Happy August, and welcome back! Let's dive into the latest Supermetrics updates.
Product updates
Introducing: Account Tagging
We know that managing numerous accounts across platforms can be challenging. Our latest feature, Account Tagging, has been created to solve this problem. The new feature is available for all Supermerics users.
With this simple yet powerful feature, you can choose different data source accounts and categorize them according to your needs. Watch how account tagging works in action.
Why should you tag accounts?
With Account Tagging, you can search, select, and tag accounts to create dynamic groups, and then, instead of picking accounts in reporting tools, you can choose the tags you’ve created.
This will allow you to:
- Increase reporting efficiency: Quickly filter and access grouped accounts.
- Create more flexibility: Create custom tags for various use cases like regions, clients, or specific projects.
- Enhance data management: Easily separate and organize your data to let you jump to insights faster.
Log in to the Supermetrics Hub. Choose the data source for which you want to create tags and start tagging the accounts according to your needs. Created tags are available for you across different reporting tools. Read more about how to get started with account tagging from our support article.
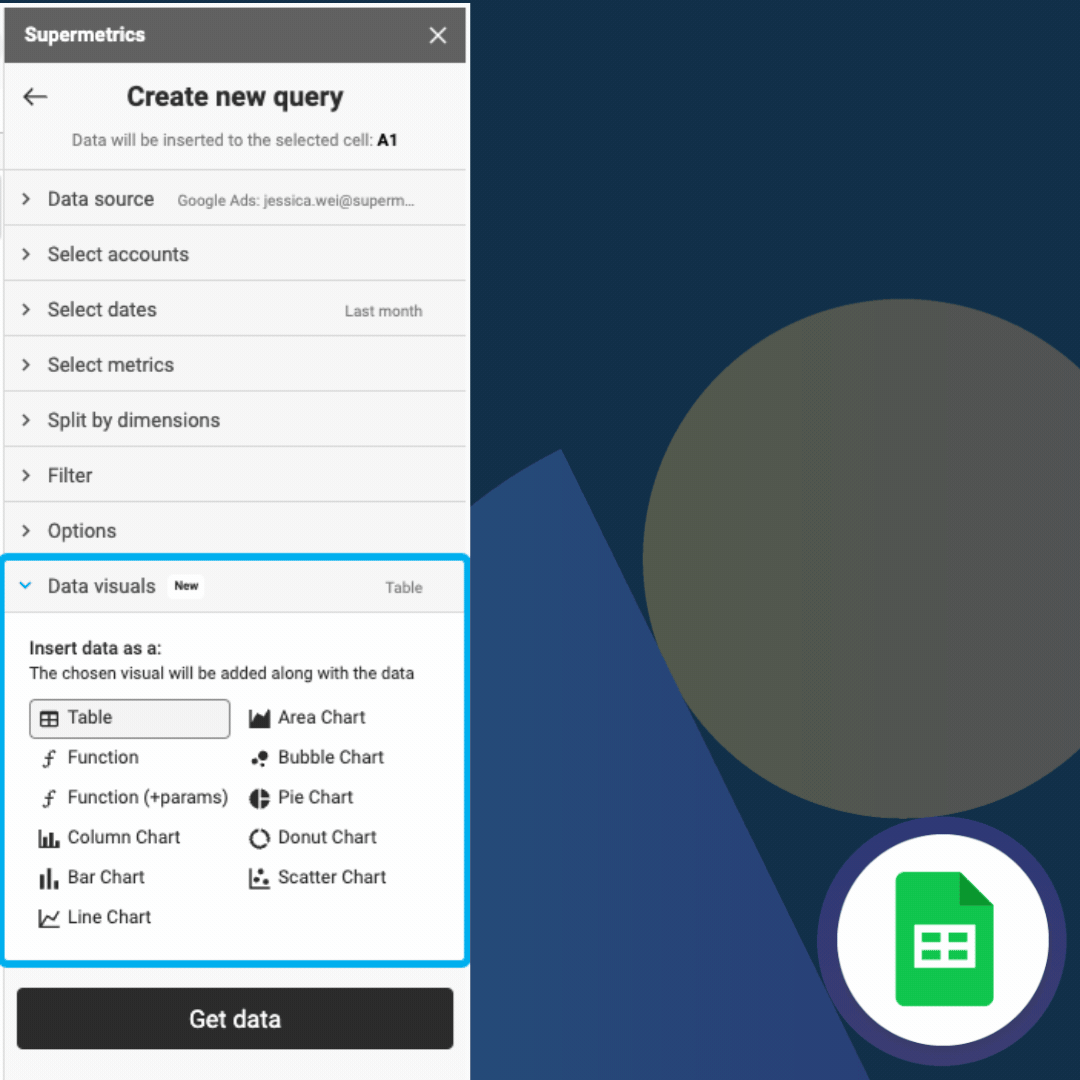
Try different visualization options when creating a new query
Did you know you can transform your data into stunning visuals right within Google Sheets sidebar? Easily create impactful charts, maps, and more by selecting different visualization options when creating a new query. Try this out to make your report more impactful and visually appealing.
New early-access connector
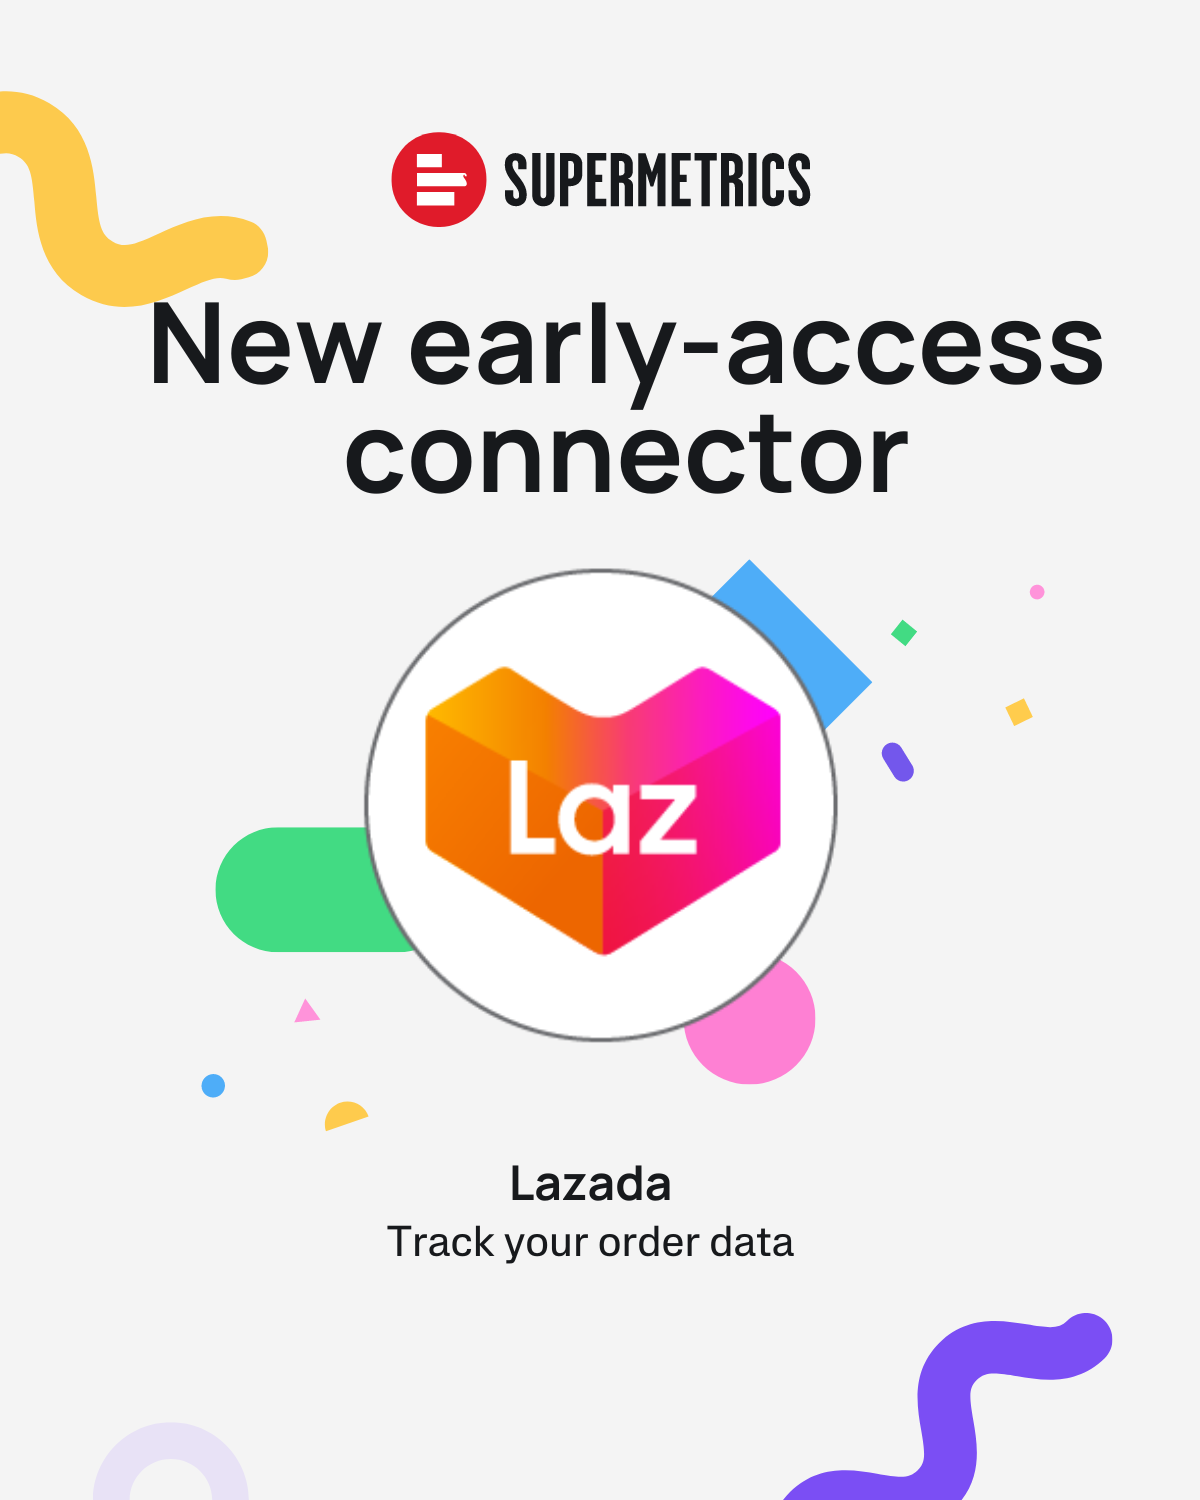
This month, we're bringing you the long-awaited connector for ecommerce: Lazada 🎉
With this connector, you can:
📈 Visualize your sales trends over time and find room for improvement
🔎 Fetch first-party customer data for re-targeting purposes
🤝 Combine with data from other marketing channels to understand how your initiatives influence sales
With 42 dimensions and 11 metrics, the possibilities to uncover insights and optimize are endless.
Our Lazada connector is currently available in early access.
👉 Try now!
Psst! We also have a community group to discuss all things Lazada in more detail. Join us!
Connector of the Month: HubSpot
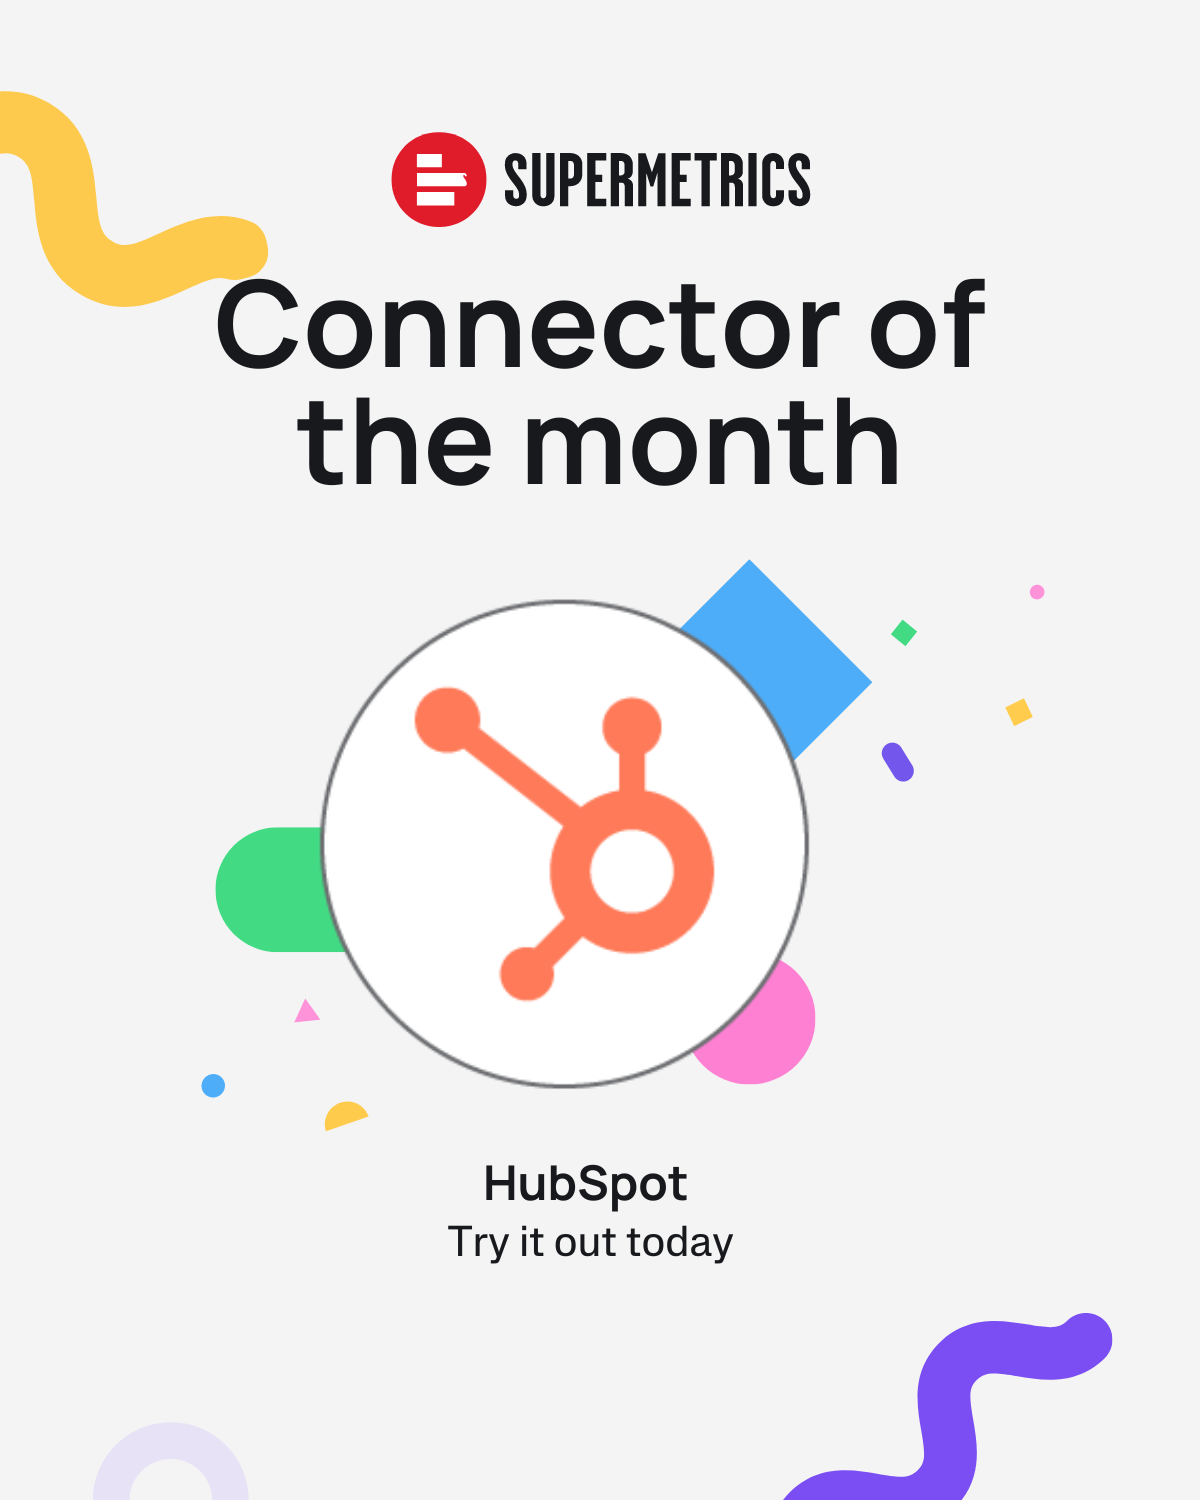
HubSpot has revolutionized marketing by offering a unified platform for CRM, marketing automation, sales, and customer service. Our powerful data source connector unlocks the full potential of your HubSpot data.
With this connector, you can:
- Centralize all key metrics: pull and analyze different data, such as contacts, leads, amount won, and email engagement from multiple HubSpot accounts in one single view
- Visualize your full funnel: combine HubSpot data with those from other marketing channels to understand which campaigns are bringing the most leads and the ROI of your overall marketing activities
- Uncover insights seamlessly: create complex and interactive client-facing dashboards that drill down data on a granular level
You can try our HubSpot connector free for 14 days.
Start here.
Connector improvements
We're constantly working on improving our connectors, and here are the latest improvements to our existing connectors.
X Ads new fields
In our X Ads connector, we have added several new dimensions that now show the same IDs as you would see in the Ad Manager UI. This addition will make it easier for you to compare your results with the UI.
- Account UI ID
- Campaign UI ID
- Ad group UI ID
- Funding instrument UI ID
Upgrades to Meta Graph API v20.0
Following Meta’s launch of Graph API v20.0 with several changes for developers, we have upgraded our Meta connectors to v20.0 as well:
- Facebook Ads
- Facebook Insights
- Facebook Political Ads
- Facebook Public Data
- Instagram Insights
- Instagram Public Data
Community highlights
Creating groups and histograms with Looker Studio
Have a look at this post, where our Head of Data Visualization, Ralph Spandl, shows you how to create groups and histograms in Looker Studio. You’ll want to see this. 
Community challenge
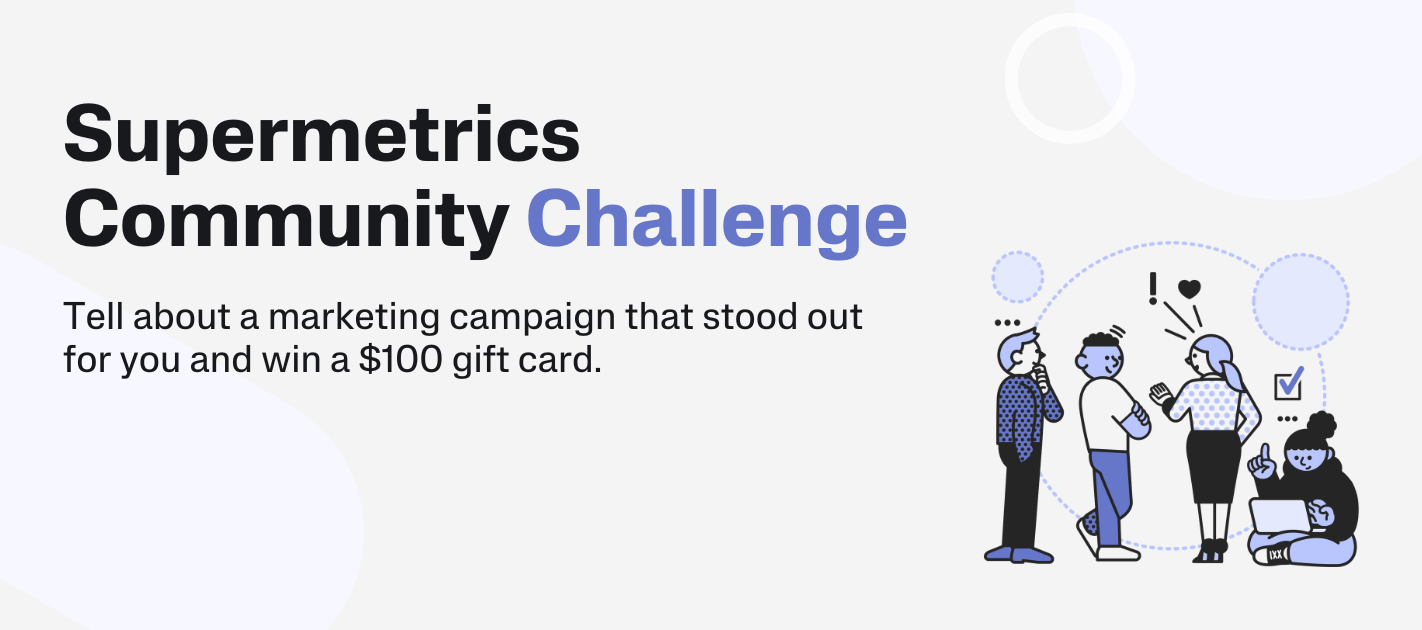
There’s still time to join our latest community challenge and win big!
How to take part in this challenge:
- In the replies to this post, share the marketing campaign that impressed you. Visuals and links are welcomed!
- Explain what made it stand out for you.
- Engage with other Community members’ posts by liking and commenting.
We'll award 2 participants with a $/€ 100 Amazon gift card: one for the most upvoted response and one for the response chosen by the Supermetrics Team 🎁✨
Events
Webinar: Marketing Data Warehouse Mastery: Best Practices and Insights
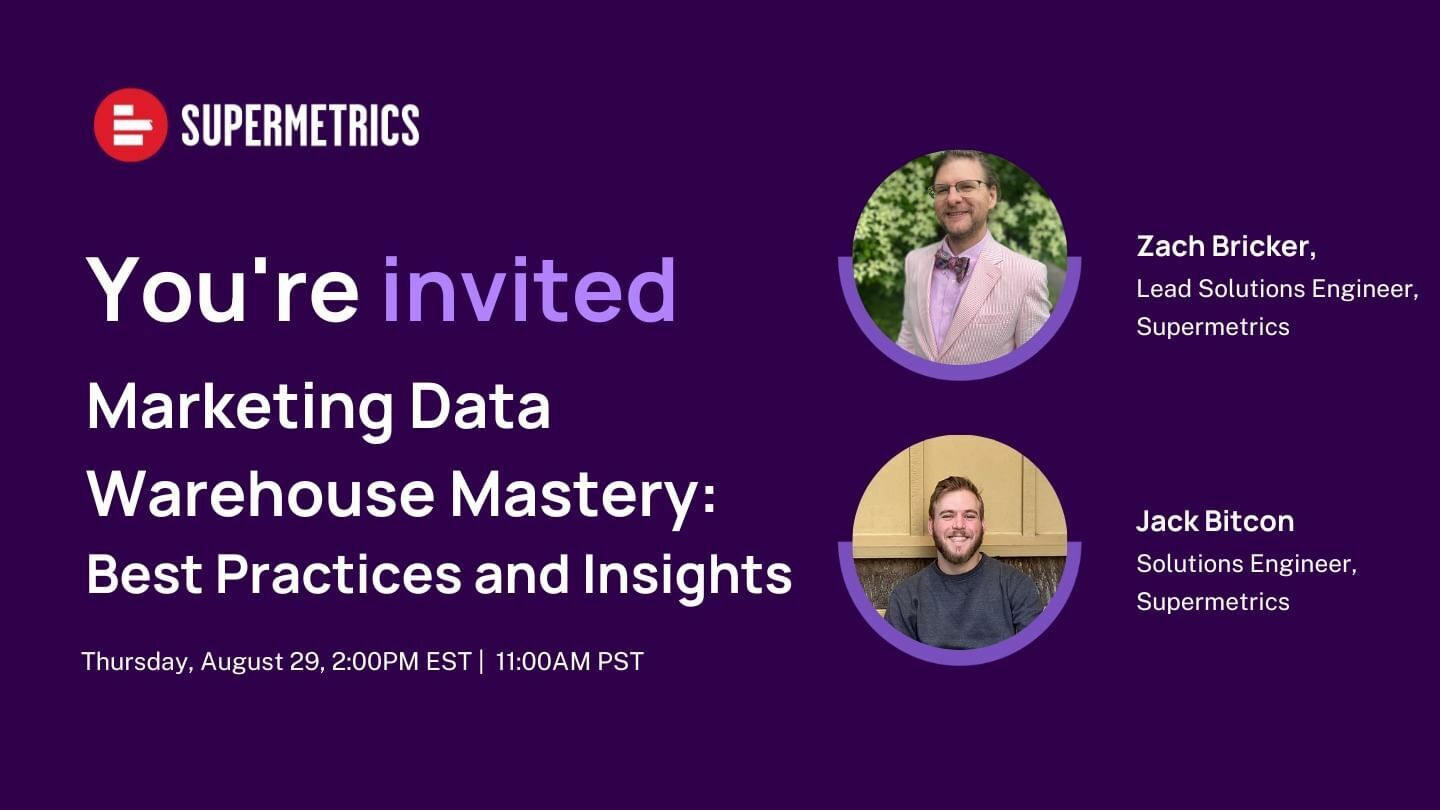
Drowning in data but struggling to turn it into actionable insights? Join us for an enlightening webinar where we explore how a marketing data warehouse can revolutionize your data management and optimization processes.
Agenda:
Intro: We'll kick off with a compelling story about a marketing firm overwhelmed by data, illustrating the common challenges faced by many organizations.
Identification: Discover the telltale signs of data struggles, from slowness and volume to privacy concerns and complexity. We'll delve into how these issues hinder marketing performance and share a real-life case study, supported by visuals, to set the stage for our discussion.
Building: Learn about the critical steps and decisions involved in choosing the right data warehouse. We'll highlight the importance of simplicity in data management and showcase how Supermetrics' intuitive data structure can streamline your processes.
Integration: See how Supermetrics' powerful transformations and data blending capabilities can enhance your data warehouse's functionality. Through another case study and impactful visuals, we'll demonstrate how Supermetrics can "supercharge" your data management.
Conclusion: We'll recap the journey from identifying data challenges to building an optimized data warehouse with Supermetrics. Emphasizing the importance of storytelling in delivering actionable insights, we'll show how transforming your data isn't just about creating dashboards—it's about crafting narratives that drive impactful results for stakeholders and client
Don't miss this opportunity to transform your marketing insights and master your data with a marketing data warehouse.
Data Expo in Utrecht
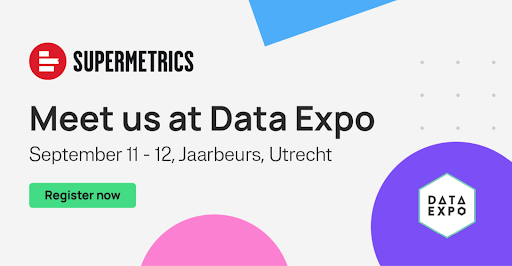
We're thrilled to announce that our team will be at Data Expo in Utrecht on September 11-12! Join us at our booth to discover the latest innovations and updates from Supermetrics. Don't miss out on the chance to engage with our experts and participate in our exciting competition, where you could win some fantastic prizes!
Be sure to mark your calendars and come visit us—we look forward to seeing you there!
DMEXCO in Cologne

We’re excited to join DMEXCO in Cologne on September 18-19! Come visit our booth to explore the latest updates from Supermetrics.
Plus, don’t miss our exclusive masterclass taking place on the September 19 at 10:00 a.m.
Together with Google Cloud we’ll dive into the topic of "Modern Marketing Measurement with Supermetrics and Google Cloud". It's an excellent opportunity to gain valuable insights into advanced marketing strategies and data integration.
Save the date and join us in Cologne for an event you won't want to miss!
 Podcast: Manscaped’s edgy marketing: How data & analytics drive risk and reward
In this episode of The Marketing Intelligence Show hosted by Supermetrics, learn how Manscaped uses analytics to transform feedback into cutting-edge products with . We’ve delved into the risk vs. reward of their edgy marketing strategies and how they leverage data to measure success and maximize impact.
Tune in to learn:
- How Manscaped uses analytics to optimize marketing campaigns.
- How Manscaped A/B tests to find what resonates with customers.
- Manscaped's top-of-the-funnel approach to reach new audiences and expand retail partnerships.
- How Manscaped leverages customer feedback and data from Supermetrics to improve products and experiences.
Listen to the full episode here.
That’s all for now! See you again in September.
 One of my favourites is the upcoming webinar about data warehousing, such a timely topic and we haven’t had one in a while so I highly recommend signing up

 We’re also excited about Lazada