Looker Studio has added two new calculated field types in the past month: groups and bins. These features make it easy to group dimension values into larger categories or bin values to create histograms. In a recent article, I covered how to use the graphical UI to create bins. Let's also take a quick look at how to create groups.
Creating Groups
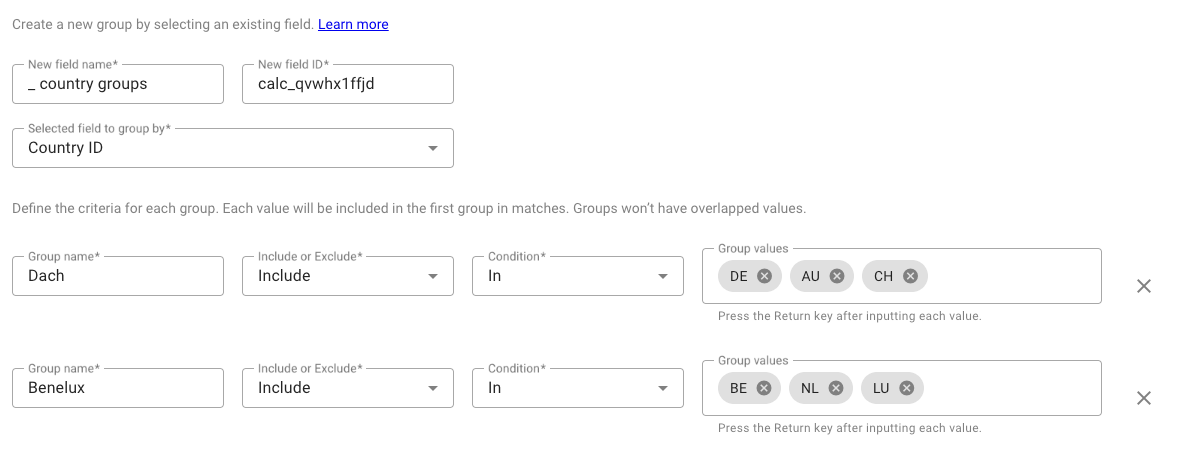
When creating a new field of type "group," you must choose a dimension field and define each group. The options are similar to filters. You can create groups by inclusion or exclusion and use different selection types, such as regular expressions or a new option called "In," which lets you manually select the dimension values.
A workaround for previously aggregated data
The article could end here, but there are cases where it isn’t possible to use the graphical interface to create bins. Common use cases involve data from GA4 connectors, where many metrics are pre-aggregated. For example, the metric Event Count is always displayed as SUM and never as average or any other aggregation.
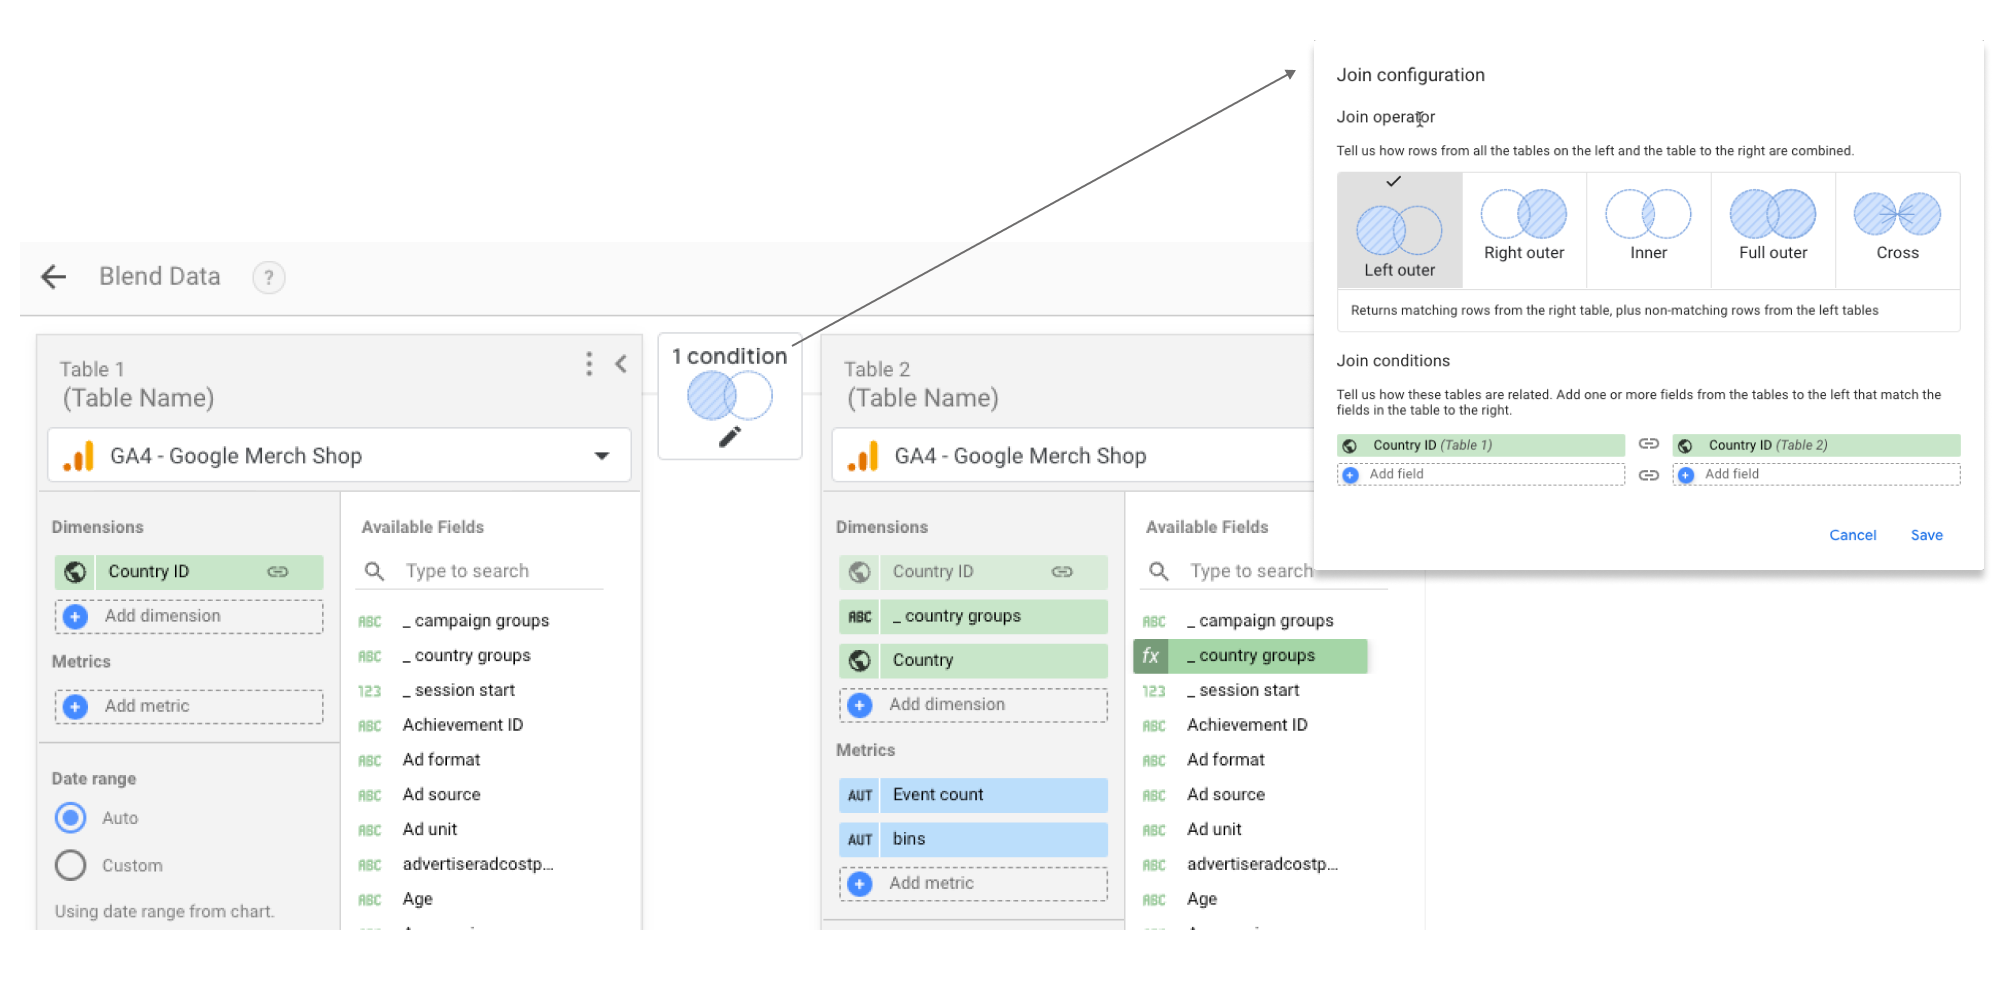
To get around this issue, Looker Studio recommends re-aggregating the data by blending the table with itself.
If we want to create bins for event counts and countries, we can create a left join on the dimension Country ID and add the metric "Event Count."
Using calculated fields for the bins
The result of the self-blend will be a flat table with Country and Country ID as dimensions and Event Count as a metric. Event counts can now be aggregated in different ways, and it is also possible to create bins for the histogram.
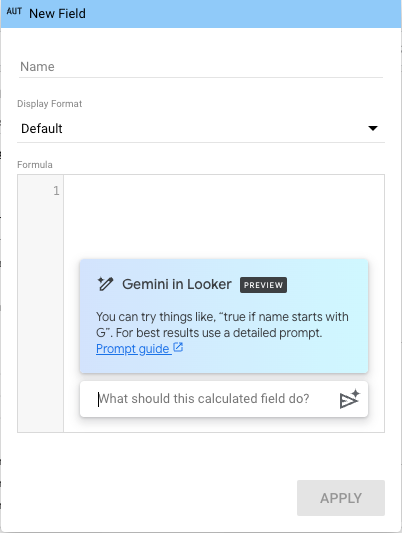
However, if we create a new field within the blending interface, the calculated field types group and bin aren't available. As a result, the bins must be created with a calculated field.
While it is less convenient to create bins with calculations, it isn’t that hard. Here is a simple example of a calculation with three bins:
CASE

WHEN Event count BETWEEN 0 AND 1000 THEN '0-5000'

WHEN Event count BETWEEN 5001 AND 10000 THEN '5001-10000'

WHEN Event count >10000 THEN '10K+'

END
Gemini for Looker Studio Pro
Users with access to Looker Studio Pro and who are new to calculated fields or need help with their next project can now use Gemini, the AI assistant of Looker Studio. With Gemini, users can enter text prompts to create ready-to-use calculations.
The result may differ each time, as there are multiple ways to create bins. Here’s a simple text prompt:
"Create 10 bins based on event count from 0-1000, 1001-2000, and so on."
Gemini will generate the following code, or something similar:
CASE
WHEN Event count BETWEEN 0 AND 1000 THEN '0-1000'
WHEN Event count BETWEEN 1001 AND 2000 THEN '1001-2000'
WHEN Event count BETWEEN 2001 AND 3000 THEN '2001-3000'
WHEN Event count BETWEEN 3001 AND 4000 THEN '3001-4000'
WHEN Event count BETWEEN 4001 AND 5000 THEN '4001-5000'
WHEN Event count BETWEEN 5001 AND 6000 THEN '5001-6000'
WHEN Event count BETWEEN 6001 AND 7000 THEN '6001-7000'
WHEN Event count BETWEEN 7001 AND 8000 THEN '7001-8000'
WHEN Event count BETWEEN 8001 AND 9000 THEN '8001-9000'
WHEN Event count >= 9001 THEN '9001+'
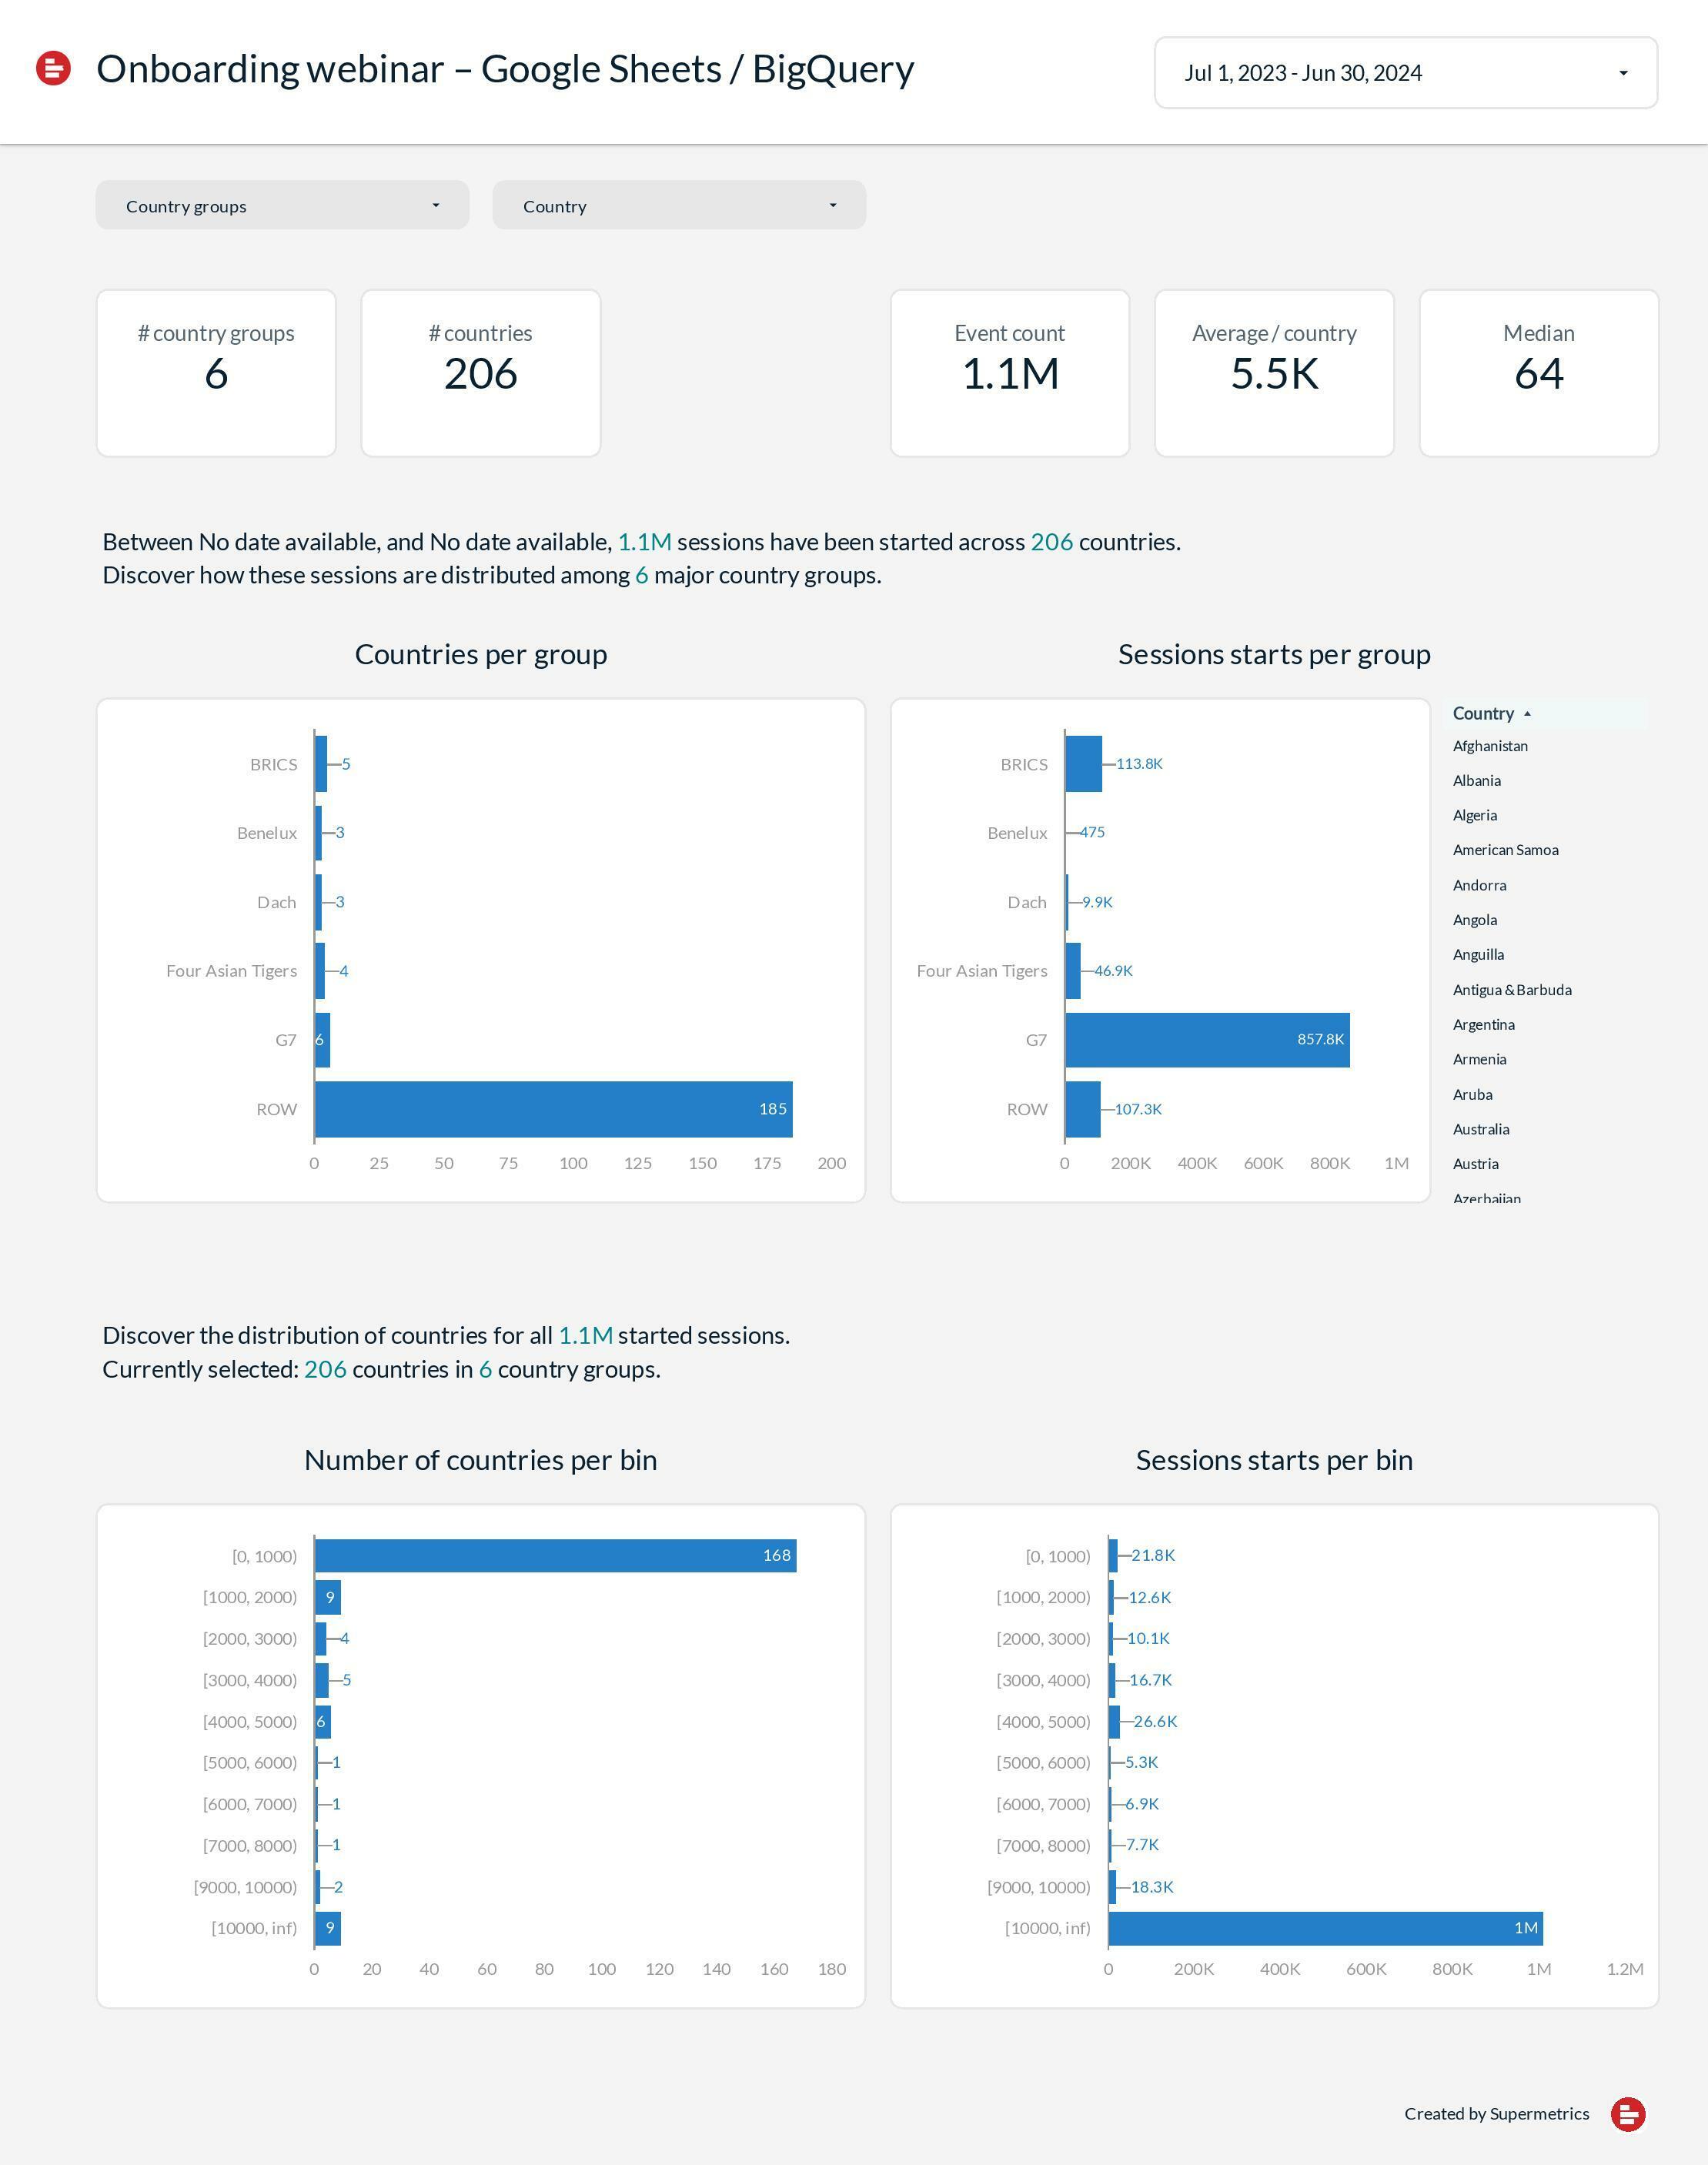
ENDSample report
Enough theory. Find out what kind of insights you can get from a simple list of countries and event counts by visiting our grouping and binning sample dashboard.