
Ā 

Welcome aboard, marketing analytics gurus! šŸŽ‰

Ā 

We're thrilled to launch our very firstĀ Supermetrics Community Challenge.Ā Our Community Challenges are a chance for us all to dive into the exciting world of marketing analytics in a fun way.Ā 

Ā 

The rules of the first Challenge are simple:Ā 

  • In the replies to this post, shareĀ your favorite marketing analytics trickĀ you wish you knew sooner.
  • ā€œLikeā€ the replies of other Community members that resonate with you the most.

Ā 

We'll award 2 participants with aĀ special gift box worth $200:Ā one for the most upvoted response and one for the response chosen by the SupermetricsĀ Team šŸŽāœØ

Ā 

ā³ The challengeĀ ends on June 30, 2024.Ā 

Ā 

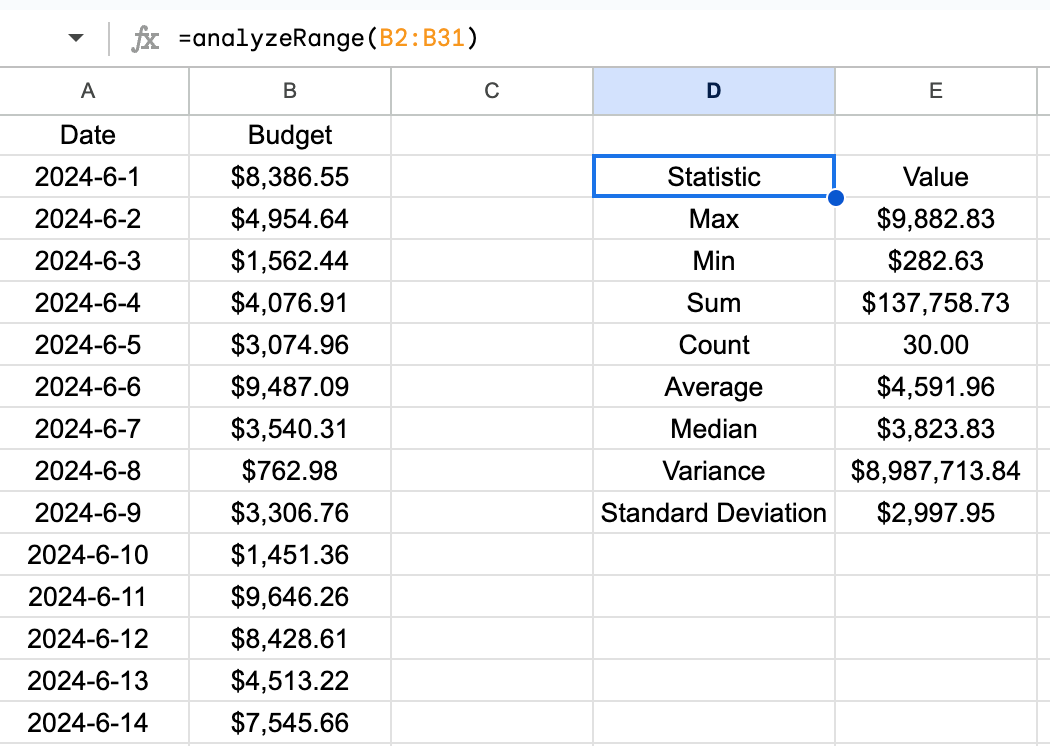
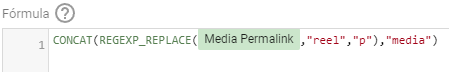
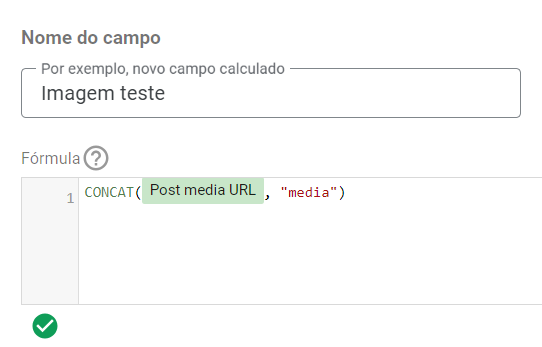
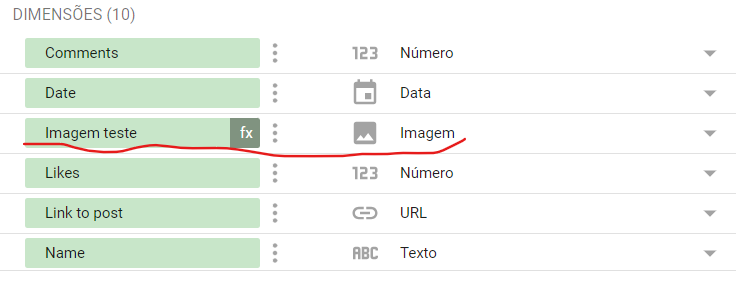
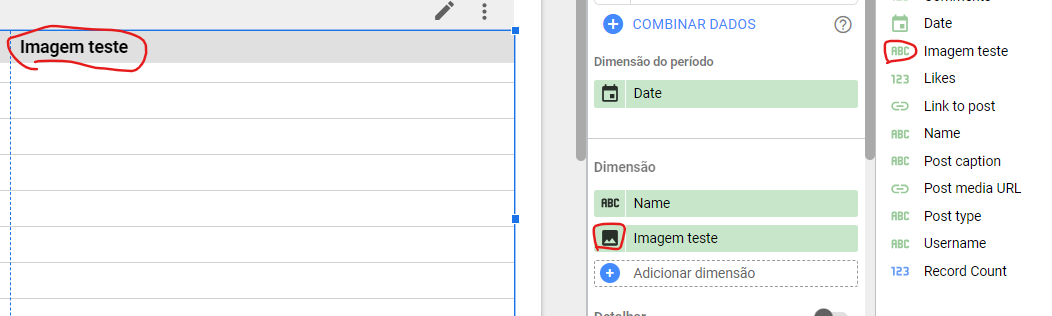
Our example of the trick: when analyzing the performance of different ad creatives in Google Sheets, use the formulaĀ =IMAGE("URL"), where the URL is the public web address of that image. It'll add an image of the ad to your report and make it more descriptiveĀ šŸ¤©Ā Hereā€™s our short demo video.Ā 

Ā 

Can't wait to see your answers!Ā 

Ā 

P.S. Commenting is possible only after you log in to the Community.Ā 

This one is easy! I wish I knew about the Sparkline function in Google Sheets sooner! It is the most amazing thing if you just want to see a small visualization of data without having to do an entire chart.Ā 

Here are two examples of how I use it in my Google Sheets reports: one is a bar chart (green and red) and the other is a simple line graph.

Ā 

Here is a helpful article that gives inspiration:Ā https://blog.coupler.io/sparkline-google-sheets-function-explained/


My favourite marketing analytics trick is adding secondary dimensions in Looker Studio. I wish I had known about it earlier asĀ I remember previously telling people that it couldnā€™t be done, until I came across this blog post by Mehdi Oudjida:Ā https://how.withlookerstudio.com/advanced-controls/20200825-google-data-studio-secondary-dimension-like-inside-google-analytics/.Ā 


Itā€™s very useful to be able to switch to campaign / ad group / keyword data easily.Ā 
Ā 

Here is a video showing it as an example I made in a google ads account (ignore the values and text, it has been mixed up using his Looker Studio Extension).Ā 


My favourite marketing analytics trick is the sumifs function in Google Sheets to aggregate and connect data from different sources and for different timeframes in order to keep the number of API requests at a minimum.


My favouriteĀ looker studio trick that I discovered some 5 years ago, is using a (somewhat) hidden google API to fetch favicons for basically any domain. It really makes a nice, and more visual, presentation of traffic sources in my dashboards:

I just add the source-dimension to this google url (https://www.google.com/s2/favicons?domain_url=supermetrics.com) and get a png back (sometimes you have to manually adjust some sources so itā€™s a domain, likeĀ if youā€™re using another naming conversion on utm_source tags for example)

Ā 


Our favorite marketing analytics tip is to watch the playlist from the fabulous Siavash Kanani for data blending and understanding how different join types work (chapter 10), including an excellent hint on how to use the COALESCE() formula.

It helped us a lot in combining different data sources into one joint data source, resulting in more insightful charts and tables!

Ā 

Happy campaigning everyone <3

Ā 

Best regards.

Robin


While it was scary and took a bit to nail down properly, I think the biggest upgrade by far was implementing a data warehouse. After scaling our Looker Studio use case to the absolute max, and dealing with broken APIs from how many times our data was getting accessed, it was a breath of fresh air to see reports just populate in seconds without issue. Learning SQL was a journey, but if I knew how simple it all was by the end, I would have jumped on it from the beginning.


Use Single filter for Multiple Data Sources in Looker Studio

We know that in Looker Studio when we add data control like a dropdown selector we need to add a data source and the control only applies to charts with that data source. Yes thereā€™s the option of ā€œCross-filteringā€ but that does not work with all chart types like scorecards.

The solution was to create custom fields with the same ID.

Lets say we have two data sources - GA4 and Google Ads and we want to filter for Campaign Name.

  1. Create a calculated field in GA4, which is nothing but the the dimension name like Session Campaign.Ā 
  2. Make sure you copy the field ID on the top right, which is something like calc_12432435.
  3. Now in the other data source, Google Ads; create a calc field and paste the same ID you copied from before. (VERY IMPORTANT TO CHANGE THE ID ON THE FIRST TIME ITSELF AS AFTER SAVING IT IS NOT ALLOWED TO EDIT THE FIELD)
  4. You are good to go now, use any of the above calc fields as filters and it will work with both the data sources!

I couldnā€™t find the article where I learnt this from, but the author wasĀ Mehdi Oudjida


So hard to pick one!Ā šŸ˜¬

I would go for ā€˜user defined functionsā€™ in Google Sheets.

itā€™s really magicalĀ šŸŖ„

You know when your formula gets clippedĀ in the formula bar? Iā€™m done with those.Ā if the formula is too long and tedious - I convert it toĀ a custom formula.

Endless use cases - starting from formattingĀ the endless ways users writeĀ phone numbersĀ into a specific format, splitting campaign names based on different naming conventions, to integrate 3rd party APIs for various tasks.

It also makes debugging formulas much easier and saves a lot of time!

Iā€™ll share one simple example we use:Ā getting all statistical measurements in one simple formula
Instead writing 8 different formulas, I have only this formula, and it can be used anywhere and anytime

=analyzeRange("B2:B31")

to create this:


You all welcome to share more use cases you think a custom formula can solve!


Love a bunch of the ones listed already!

I really appreciate all theĀ IMPORT functions. Sometimes I justĀ need a quicker way to gather all my inputs and be able to organize information in the manner that I want to see it. Some ways Iā€™ve used these in my past is tracking for SEO like metadata changes from websites. Iā€™ve also used it to gather customer feedback/reviews.

  • IMPORTHTML -Ā Imports data from a table or list within an HTML page.
  • IMPORTDATA -Ā Imports data at a given url that is in cvs or tsv format
  • IMPORTFEED - Imports RSS feeds
  • IMPORTRANGE -Imports ranges from anotherĀ spreadsheet

Ā 

(Also similarly, sharing a nod toĀ GOOGLEFINANCE functions that essentially are import functions for historical and real-time stock market data!)


Blending Data and collating multiple metrics/dimensions under a singular field has been a huge saviour! Using a simple code, I can blend all my tablesā€™ matching metrics under a single field or combine similar metrics - for example:

  • If Iā€™m trying to blend impressions across multiple socials for a singular video, I can blend these sources then use the below statement to combine FB, IG and TT video views under the same metric ā€œcombined viewsā€
  • If I want to pull video thumbnail and image thumbnail under a singular ā€˜thumbnailā€™ field, rather than having both columns taking up room in a table and showing a lot of blanks

The formula is:

CASE

WHEN

WHEN

WHEN

ELSE ā€˜N/Aā€™

END

Ā 

This solves my problem of having too many columns in a singular table - or I can pull a scorecard with combined values across multiple sources.Ā 


My favorite marketing analytics trick is to use the SupermetricsQueries tab to update ALL the public social media data I need to track at all times. After changing the start date and end date, just click on "refresh all queries" and, like magicšŸŽ©, everything is updated! I don't need to go from tab to tab to do this and waste a lot of time.Ā 

Ā 


For those who use Google sheets integration, you can now directly create a new looker studio report from within Google Sheets.

Ā 

Ā 


I recently learned that in Looker Studio you could overcome some of the filtering limitations within a data source by blending it with itself.

In my case, I wanted to have Google Ads data that showed only metrics for a particular subset of campaigns (based on a substring within theĀ Campaign name) and only a specific type of conversion (based on Segment Conversion Category). I set up one instance of the data to pull & filter the ā€œfront-endā€ (engine-side) data and one instance to pull & filter the ā€œback-endā€ (conversion) data and joined on campaign ID:

Ā 

This allowed the data to be aggregated and filtered the way I wanted without the errors I was getting when I tried to apply both filters to the overall data set.

Note: I almost certainly didnā€™t need to include Cost in both tables, but wanted to include it just in case because Iā€™d be calculating CPA.


Instagram ImageURL to your Dashboard

Ā 

If you already noticed, when you use SM dimension ā€œimage urlā€ you receive a temporary image link, as Facebook keeps changing the image diretory.

Try this as a solution:

  1. Export the media permalink;
  2. Create a new field using this formula CONCAT(Media Permalink, ā€œmediaā€);
  3. Youā€™re good to go.

As reels use a slightly different permalink, you need to repalce ā€œreelā€ for ā€œpā€ in the URL. So you have this formula that works for feed posts and Reels.

Ā 

Ā 


The most common question we always seemingly get asked, and I was definitely a culprit of this question a lot early in my career. ā€œWhen was this last updated?ā€Ā 

A simple way to do this is to have a status bar at the top of the page, then using conditional formatting to highlight dates that are unexpected, if before today minus 1 day then highlight in yellow, is one I have used previously.Ā 

A mock up of one of our dashboards is above, where we use logos of the data source and then have mapped the dimension to the logo name.Ā 

I love that you managed to blend in this rather dry (but important) bit of info with the overall design of the dashboard. It shows what data sources are included and what their freshness is in one sleek header. šŸ‘Œ chefā€™s kiss


Google Array Formula

Googleā€™s Array FormulaĀ has been an awesome way to automate spreadsheet processes. If you are doing custom calculations or joining Supermetrics data with other data, you donā€™t haveĀ to worry about copying down formulas in your calculation columns.

For example, if you want to turn Supermetricsā€™ ā€œYear & monthā€ field, which appears as YYYY|MM,Ā into a usable date format for each row of data. You can create a new column withĀ a formula likeĀ =ARRAYFORMULA(IF(dateFieldĀ = "" , "" , DATE(LEFT(dateField,4),RIGHT(dateField,2),1)))
Note: The IF() formula is important to useĀ as itĀ ensures that if there isnā€™t any data present, that it leaves it blank. Your spreadsheet and computer processorĀ will thank you for that.

This formulaĀ is super handy paired with automatic refreshes from Supermetrics as you can alway count on whatever calculations you have setup in your ARRAYFORMULAs, they are going to automatically resize to the row length of your updated dataset.Ā 
Ā 


My favouriteĀ looker studio trick that I discovered some 5 years ago, is using a (somewhat) hidden google API to fetch favicons for basically any domain. It really makes a nice, and more visual, presentation of traffic sources in my dashboards:

I just add the source-dimension to this google url (https://www.google.com/s2/favicons?domain_url=supermetrics.com) and get a png back (sometimes you have to manually adjust some sources so itā€™s a domain, likeĀ if youā€™re using another naming conversion on utm_source tags for example)

Ā 

Ā 

We were blown away by the incredible tips and the enthusiastic participation in this first Community Challenge!Ā šŸ‘šŸ»

The post with the most likes goes to @ErikĀ - Congratulations! Erik showed us how we can use the hidden Looker Studio feature ofĀ faviconsĀ - This concreteĀ tip is sure to be valuable for many in the future!

Additionally, Bartosz from the Supermetrics team selected Gil's entry, highlighting it as ā€œa hidden gem that would he wished he would have know about years ago.ā€Ā Congratulations, @Gil!

Again, thank you everyone who participated! Look out for more exciting challenges coming soon.Ā I'll be contacting you, @Erik & @Gil, about your prizes soon!


Reply