

Check out 3 easy tricks that’ll make a big difference for your reporting in Looker Studio 👇
Trick # 1. Use conditional formatting.
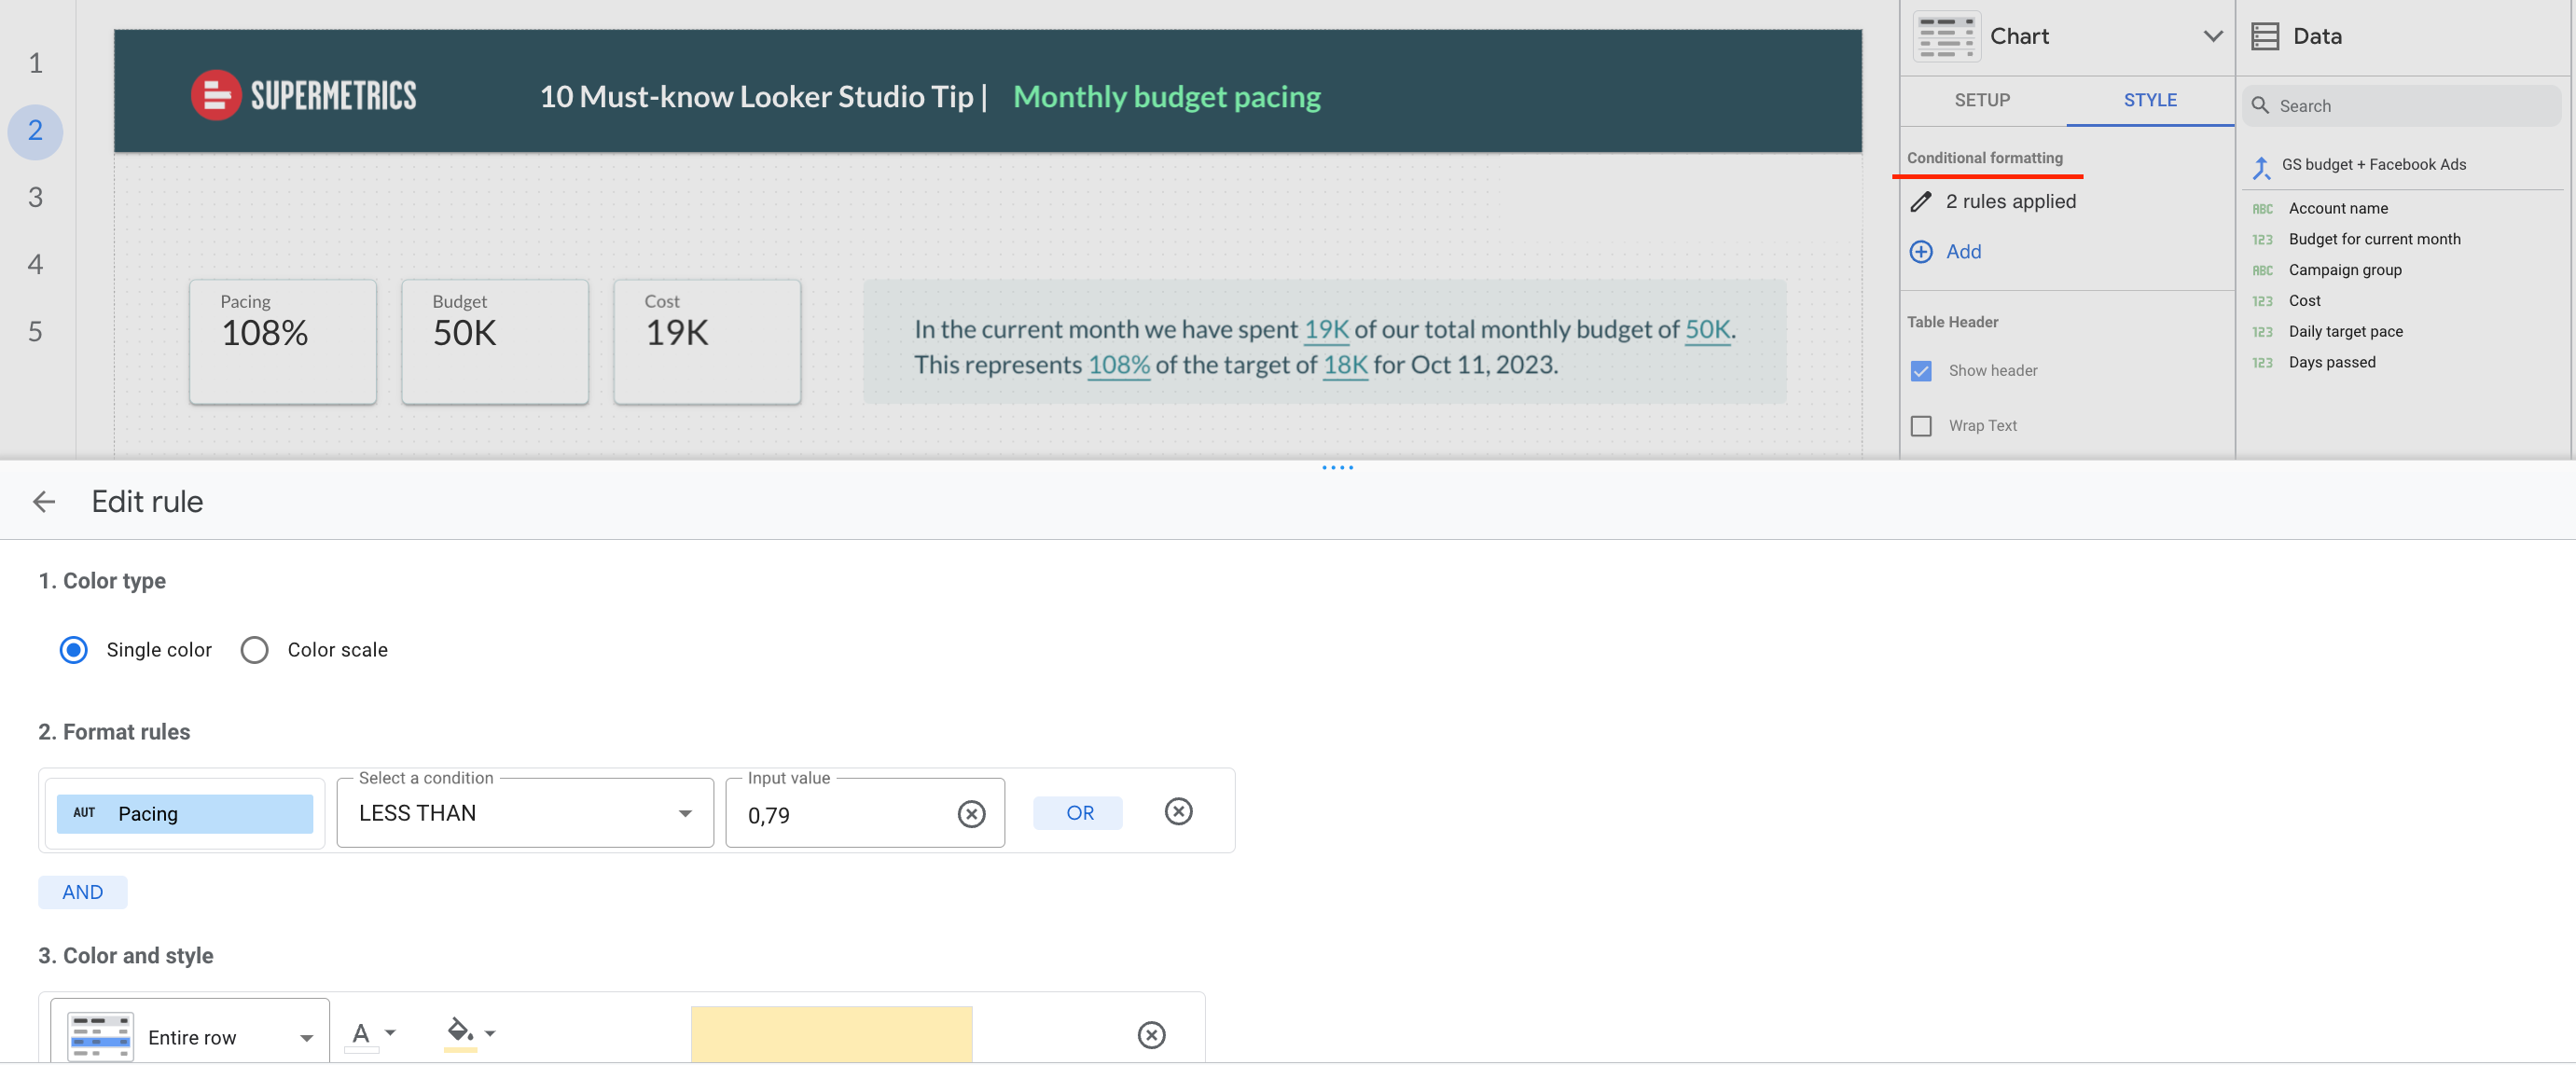
You can use conditional formatting in tables or scorecards. It lets you quickly spot outliers in your data by highlighting them with a specific color. Example use case: highlight when you’re over or under-pacing your monthly budget.
You’ll find conditional formatting under the style panel:
Trick # 2. Master report-level components.
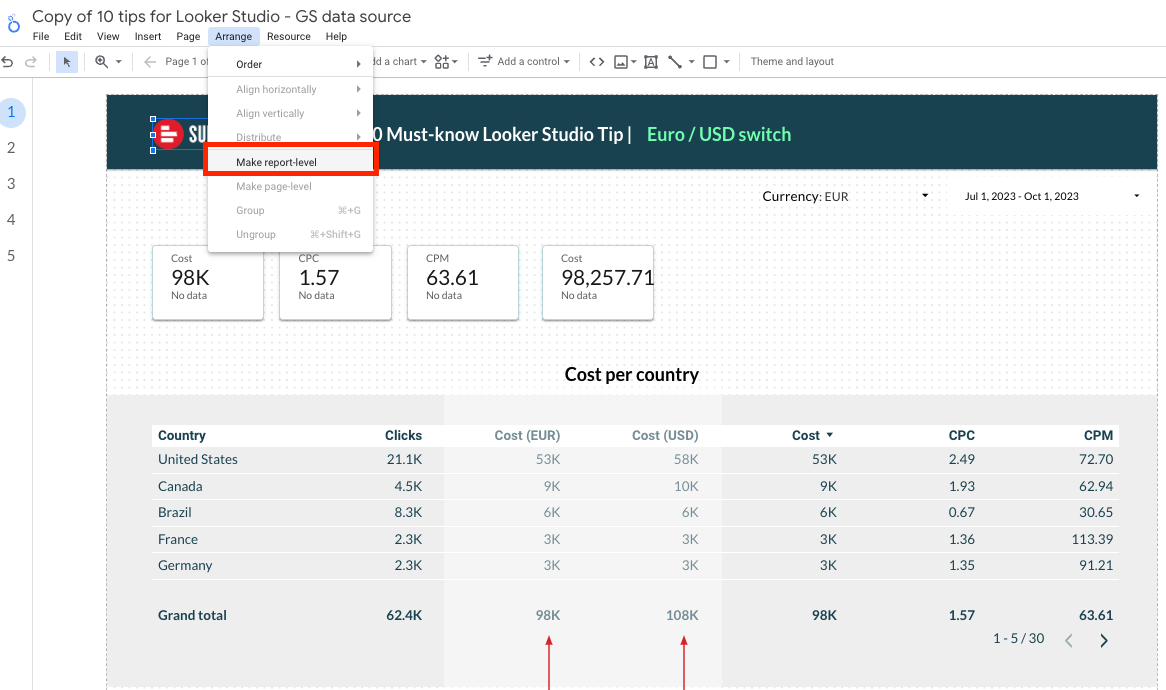
When you divide your dashboard into multiple pages by the marketing channel or campaign, it’s important to keep it consistent and aligned with your brand. You should use similar elements on different pages—headlines, colors, or your logo.
The easiest way to manage these branding elements is to set them as report-level components. For example, if you edit the component on one page, it automatically copies the changes to each page.
Trick # 3. Connect all your marketing platforms asap.
Connect all your data sources right from the start. This will help you avoid constantly setting up a connector and allow you to build a dashboard quicker and more efficiently.
You can see the full list of the data sources included in your license in the Supermetrics Hub, and connect them to Looker Studio in the data sources management page.