


We blinked, and suddenly, we’re at the end of 2025.
This year was truly defining for Supermetrics—from acquiring Relay42 and launching Supermetrics AI to leveling up with a more sophisticated brand and meeting customers across the globe.
Let’s look at the top 4 highlights of the year that reshaped Supermetrics in 2025.
1. Supermetrics AI
If 2024 was about the promise of AI, 2025 was about delivering on that promise. We launched Supermetrics AI to close the gap between having data and understanding it.
We recognize that one size doesn't fit all, so we've divided our AI strategy into two distinct areas: Supermetrics Agents, which operate within our platform, and Supermetrics AI integrations, which enable yours. Read more here.
2. Build on Supermetrics
For years, we’ve solved data for marketers. This year, we built a solution for the builders. We launched Build on Supermetrics , a set of APIs that let you build and scale white-label data products without wasting resources on maintaining fragile integrations.
Build on Supermetrics includes management APIs, data APIs, and branded authentication:
- Data APIs allow you to get cross-channel data automatically from virtually any analytics and reporting platforms. Instead of spending hours building data pipelines, Data APIs take care of the mundane tasks and let you focus on what you do best—designing and building products.
- Management APIs let you control everything behind the scenes, including workspaces, teams, users, data sources, data transfers, etc.
- Branded authentication gives you the ability to brand your authentication flows. For example, when users authenticate their logins in your data app, they’ll see your brand visuals and domain with a subtle “Powered by Supermetrics”.
3. Analyze: Insights without the export
One of our biggest shifts in 2025 was bringing analysis to the data. We heard you. You don't always want to export data to a third-party BI tool just to check a metric or visualize a trend.
- Supermetrics Dashboards: We launched pre-built dashboards directly in the Hub. These let you visualize performance in seconds, streamlining your reporting workflow and providing a head start on analysis.
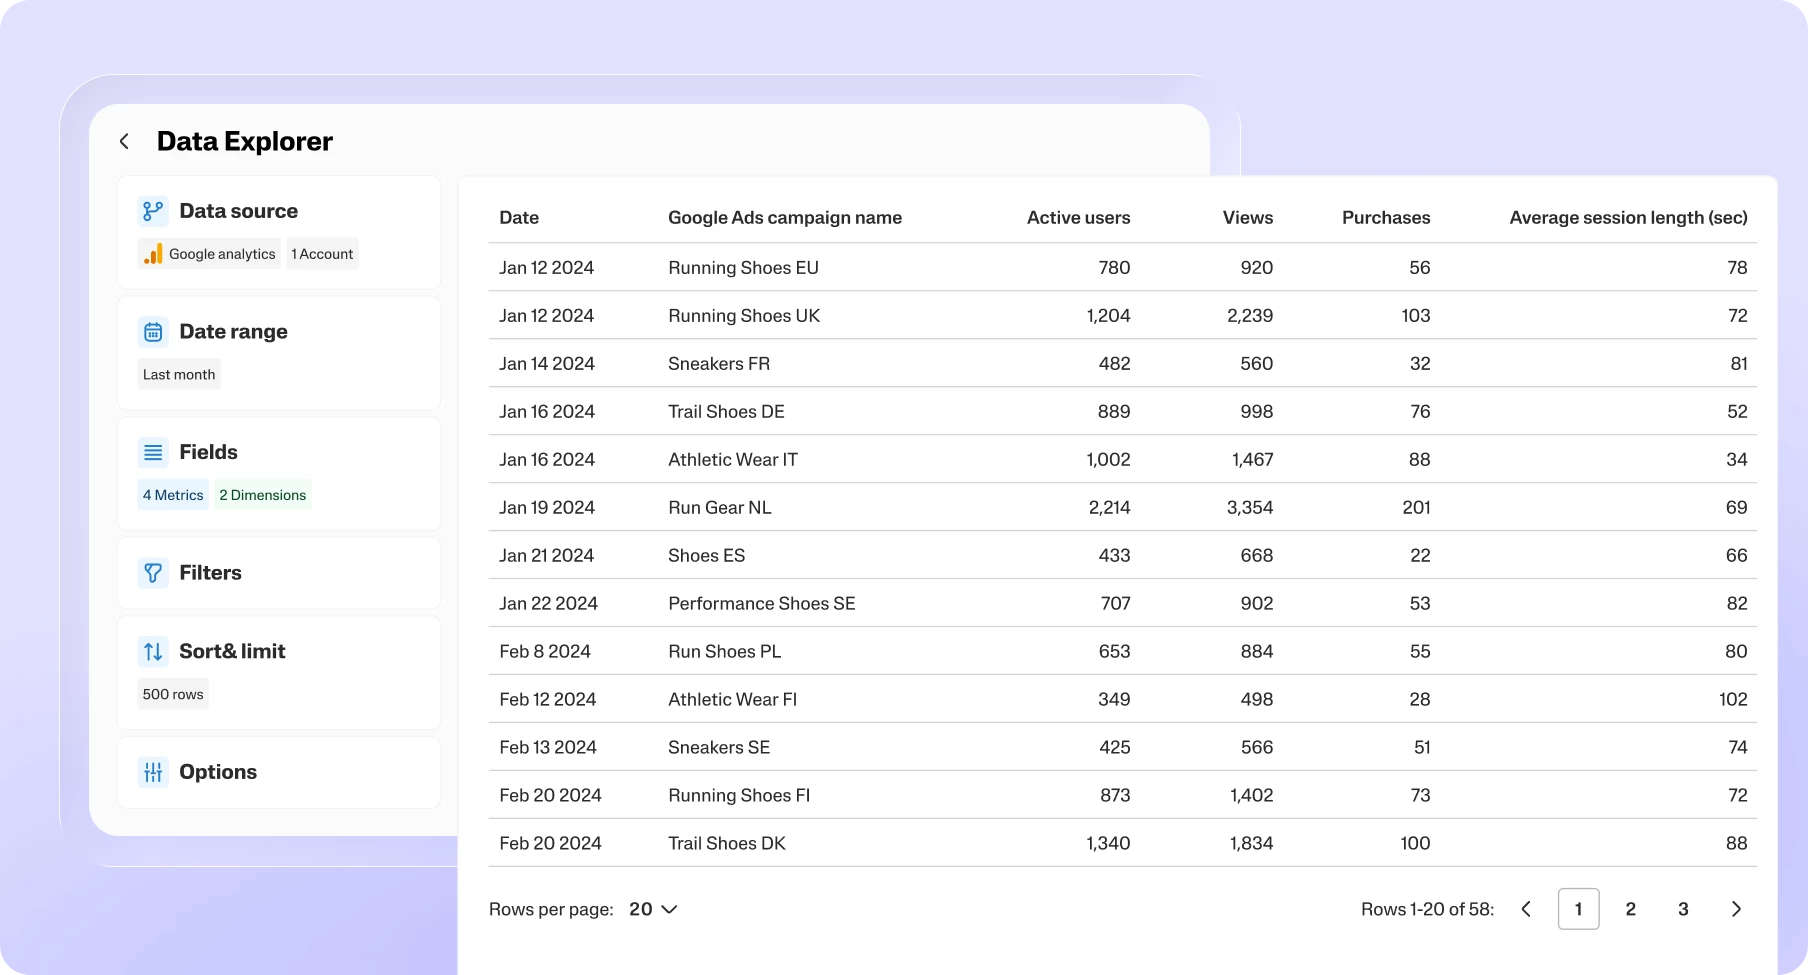
- Data Explorer: For deeper dives, the new Data Explorer lets you view data in tables, preview transformations, and save reusable views directly within the platform. It's the quickest way to validate your numbers and find answers before you even hit export
4. Marketers are shifting from traffic metrics to financial value
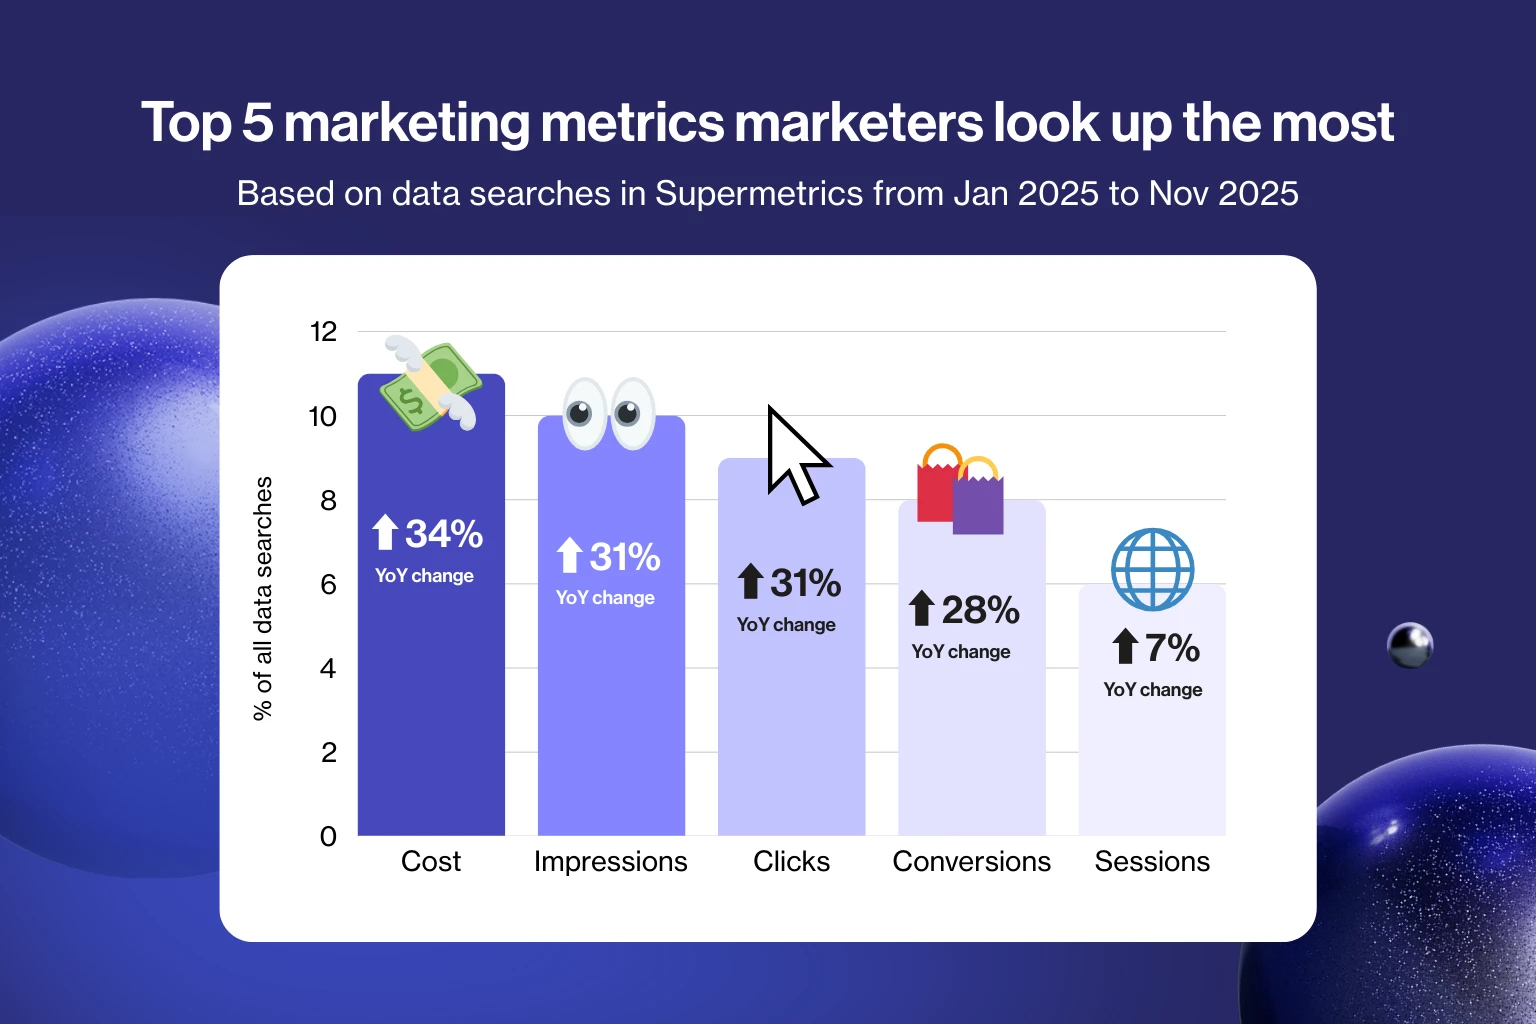
This and a ton of other insights on the full blog article - read it here.