

We’re excited to announce the launch of Data Explorer, a feature designed to help you explore, validate, and query data directly within the Supermetrics platform.
Here’s what you can do with Data Explorer:
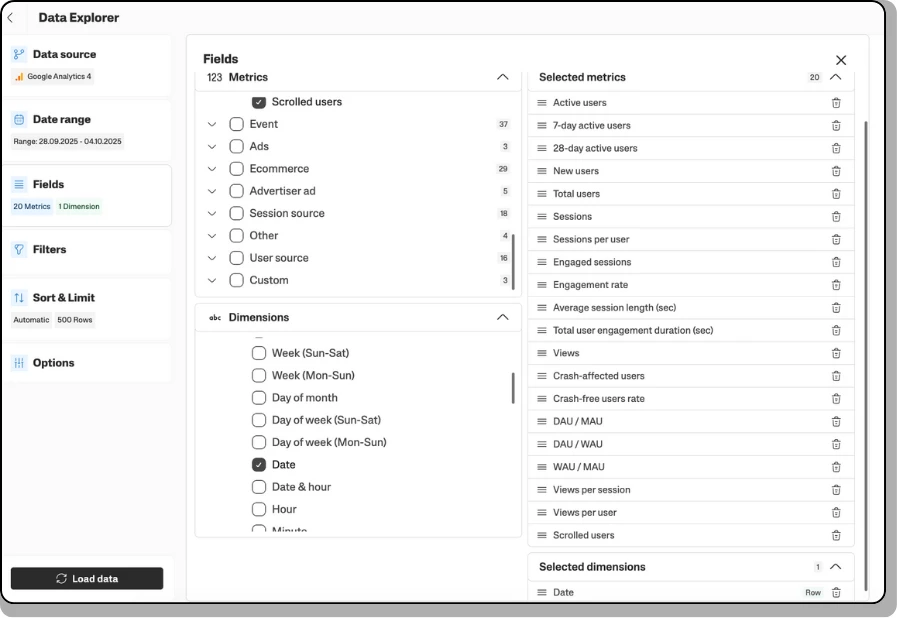
- Explore data: Access your data in a clean, tabular format for quick analysis.
- Build smarter queries: The built-in field compatibility check ensures your queries work from the start. No more trial and error.
- Preview transformations: See how custom fields or blends will look before sending data to your warehouse, or using them in your Data Visualisation tool or spreadsheet.
- Enjoy a unified experience: No need to switch between tools — everything you need is right here.
For this launch, we’ve improved the beta version by adding:
- Smarter query editing: Fields that don’t match your current data selection are now automatically disabled, helping you build valid queries faster and error-free.
- Instant trend insights: Easily compare your current performance against any previous time period (e.g., last month, last quarter) to spot growth, evolution, or decline.
- Flexible table views: Restructure your data tables on the fly to compare key metrics side-by-side (like comparing conversion rates across different campaigns or sales channels).
- Secure sharing and collaboration: Manage who on your team can view, edit, or share your data explorations, ensuring sensitive insights remain protected.
Data Explorer makes it easier to experiment, validate, and share data across your reporting workflows. Try it out and let us know what you think — your feedback helps us make it even better! Try now.