
Want to dive into your Instagram Reels data? With Supermetrics, it’s as easy as pie! 🥧 All you need to do is add one special dimension to your queries, and you’re good to go. Let’s break it down:
Step 1: Add the magic dimension
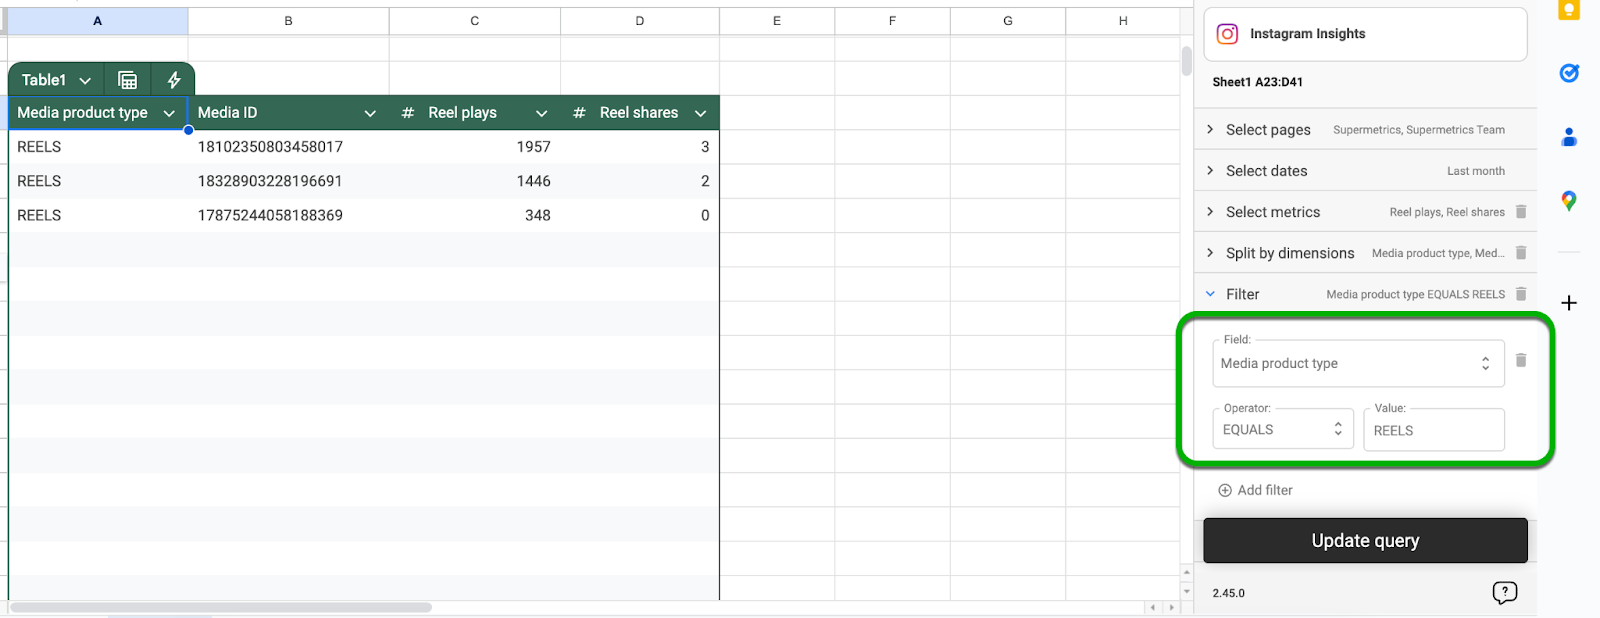
To pull Reels data, simply add the Media product type dimension to your query. Then, select “Reels” as the product type. Voilà! Your Reels data will start flowing in.
Step 2: Explore the metrics
The Instagram Insights API supports a variety of Reels metrics, including:
- Comments count
- Like count
- Media reach
- Reel plays
- Reel shares
- Total reel interactions
- Unique saves
These metrics will give you a solid understanding of how your Reels are performing.
A quick heads-up
Here’s a little FYI: Reels data doesn’t support the “Impressions” field. If you try to query it, you’ll get a null result. So, save yourself the trouble and stick to the supported metrics above.
And that’s it! Now you’re ready to analyze your Reels data. Go ahead and impress your team (or just yourself) with all the insights you’ll uncover! 🎉